Thermo Fisher Scientific

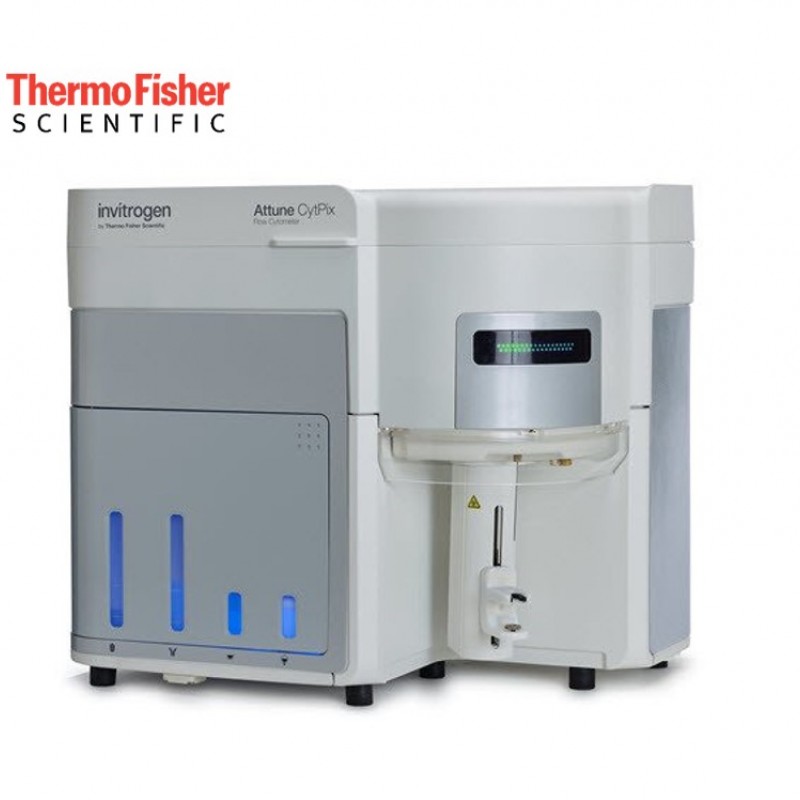
Invitrogen™ Attune™ CytPix™ Flow Cytometer

The Invitrogen™ Attune™ CytPix™ Flow Cytometer is an advanced cell analyzer that combines acoustic focusing fluids with a high speed camera for high sensitivity and high efficiency.

Attune™ CytPix™

The Attune CytPix Flow Cytometer is an advanced cell analyzer that shares common features with the Attune NxT model.

Its distinguishing feature is a high-speed brightfield camera that records images of individual events as they pass through the flow cell. The camera and Attune Cytometric Software help to ensure that the events you analyze are single cells as opposed to doublets, clumps, or debris. This is crucial in cell and gene therapy research applications, but is useful in almost any flow cytometry experiment to help researchers understand the morphology of each cell population identified for analysis. The images can also aid in identifying debris and optimizing protocols.


 Invitrogen Attune CytPix Flow Cytometer and CytKick MAX Autosampler


How it works?

As samples are acquired on the Attune CytPix Flow Cytometer, the high-speed camera captures and stores images of a sampling of events. For greater flexibility, Attune Cytometric Software lets you adjust the image capture frequency as needed, and can capture up to 6,000 images per second depending on the flow rate and image size. Acoustic focusing helps to position the cells so that a sharp image is obtained.

Acoustic focusing positions cells for optimal imaging

Without acoustic focusing , beads appear off-center and often blurry. Acoustic focusing  reduces lateral position variation, temporal variations, and depth of field limitations to obtain a sharp image.


six different flow rates show centered, sharp brightfield images


Optical focus is maintained regardless of the sample flow rate. You can image events at flow rates up to 1,000 µL/minute, and adjust the focus, imaging window, and illumination settings to your target cell type.

Capturing images of cell populations as you acquire flow data lets you select cell images and backgate them on the dot plot or histogram. This allows you to adjust your gates to include cells of interest while excluding aggregates, unwanted cells, and debris. You can combine data from the integrated cell measurement tool with fluorescence and light scatter cytometry to set and confirm gates.


Enhanced Flow Cytometry Applications with Imaging

Confirm gate accuracy. 
Imaging can be used to confirm and adjust gates to include only single cells of interest. For example, chicken erythrocyte nuclei (CEN) cells are notoriously sticky and tend to clump into doublets or other aggregates. Researchers often identify these aggregates using propidium iodide (PI) assays in which successive peaks correspond to the number of cells in an event. But imaging revealed that next-level aggregates begin to appear in the right shoulders of the preceding peaks. For example, the right shoulder of peak I (assumed to include only singlets) contained many doublets. Tightening the gates enabled successful removal of the unwanted doublets and shift them appropriately into the next gate.

using brightfield images to adjust gating on singlets, doublets, clumps, etc


Characterize cell populations. 
Morphological information from images can add to the richness of flow cytometry data. For example, the figure shows an otherwise conventional apoptosis assay using Annexin V and PI, adding cell imaging to characterize cells in each population to reveal morphologically distinct features. These insights could not have been gained from multiplex staining alone.

cell morphology is revealed using Annexin V and PI staining by images


Morphological characteristics of apoptotic cells.
Jurkat cells were incubated with 10 µM camptothecin for 4 hours at 37ºC to induce apoptosis. Samples were stained with Annexin V and PI and acquired on the Attune CytPix Flow Cytometer at 100 µL/minute. From the singlet population, gating strategies identified three cell subpopulations. About 50% of apoptotic live cells (Annexin V+PI, bottom right) showed some form of apoptotic body such as blebs. About 25% of apoptotic dead cells (Annexin V+PI+, top right) showed increased cell surface granularity, and there were more partial cells. About 10% of healthy cells (Annexin V, bottom left) showed apoptotic bodies (though not as severe as those observed among Annexin V+ cells). These healthy cells were also morphologically diverse and included some doublets despite upstream singlet gating. Morphological features in the images are indicated by black arrows.


Cell-to-cell interactions. 
Imaging can even show interactions between cells. In the figure, engineered CAR T immunotherapy cells were co-incubated with Ramos (lymphoma) cells and stained, acquired, and imaged on the Attune CytPix Flow Cytometer. Images from quadrant Q2 (positive for both stains, acquired as a single event) show the CAR T cells visibly targeting the Ramos cells, clear evidence of engineered cell potency.

CAR T cells seen targeting RAMOS cells


Discover analysis opportunities.
Backgating imaged cells on the Attune CytPix Flow Cytometer also allows you to use morphological features to discover interesting subpopulations that would not be apparent from flow cytometry data alone.

For example, E. coli cells incubated over time develop into two types of colony-forming units (CFUs): short CFUs that resemble single cells, and elongated structures with incomplete fission rings, representing incomplete constriction at each approximate cell length. Neither a traditional singlet gate (SSC-A vs SSC-H) nor a fluorescence gate (SSC vs nucleated stain) sufficiently separates these populations. But with the Attune CytPix imaging-enhanced flow cytometer, you can view and group the images and gate the CFU types based on their morphological characteristics.


images confirm single CFU morphology


Cell culture QC. Adding rapid imaging to quality control (QC) workflows can detect and track down cell culture issues early in the process. In one lab, for example, a routine passage check of a Ramos (lymphoma) cell culture observed reduced cell counts and survival despite appearing confluent. Further investigation revealed substantial microbial contamination, but when and where did it begin?

Because the cell line had previously been analyzed on the Attune CytPix Flow Cytometer, the researchers went back to the images and were able to document the microbial infection at least five days earlier. At that time, the early signs were dismissed as debris, but the retrospective evaluation demonstrated shared characteristics with the problematic cells in culture. Tracing the infection helped the lab establish additional laboratory procedures for screening and protection of assay-critical cell lines.


For more information please click.

Recommend Me a System

Please Recommend Me a Column